System View
The system view provides the ability to visualize flows from each device on the system topology. LiveNX connects flows with the same 5 Tuple (Protocol, Source IP Address, Source Port, Destination IP Address, Destination Port, and DSCP) from different devices to represent the device flows as a single flow across the system network. This provides an end-to-end visualization of the traffic path. The controls of the system flow visualization are located on the tool bar of the Flow Tab.
• Dashboard (button): launches the flow dashboard which contains quick summary of flow related statistics. • Reports (button): launches the flow reporting window which provides top analysis, time series and aggregation reports of different types.
• Table (button): launches the System Flow Table window which contains an aggregation of the flows from each device.
• Refresh (button): refreshes the flows currently drawn on the system topology and in the system flow table. The following options dictate what flows that are retrieved from the LiveNX Server:
• Flow Technology Type Selector: this provides a mechanism to restrict the types of flows that are retrieved. All Flow Types will retrieve all types. Selecting any of the following will restrict the retrieval to just the
• selected type: Application (AVC), Basic Flow, Medianet, NSEL, PfR and Unknown.
• Current Time Selector: provides a mechanism to retrieve historical flows or the current traffic flowing throw the system.
• Polling Interval Selector: provides a mechanism to specify the duration to query for the flows. For example, setting the selector to Last 30 Minutes will provide the top 200 flows for the last 30 minutes per device.
• Filter Selector: provides the ability to filter the flows retrieved during the refresh.
• Top/Bottom Flows Selector: provides the ability to set the number of flows per device to retrieve during the refresh process.
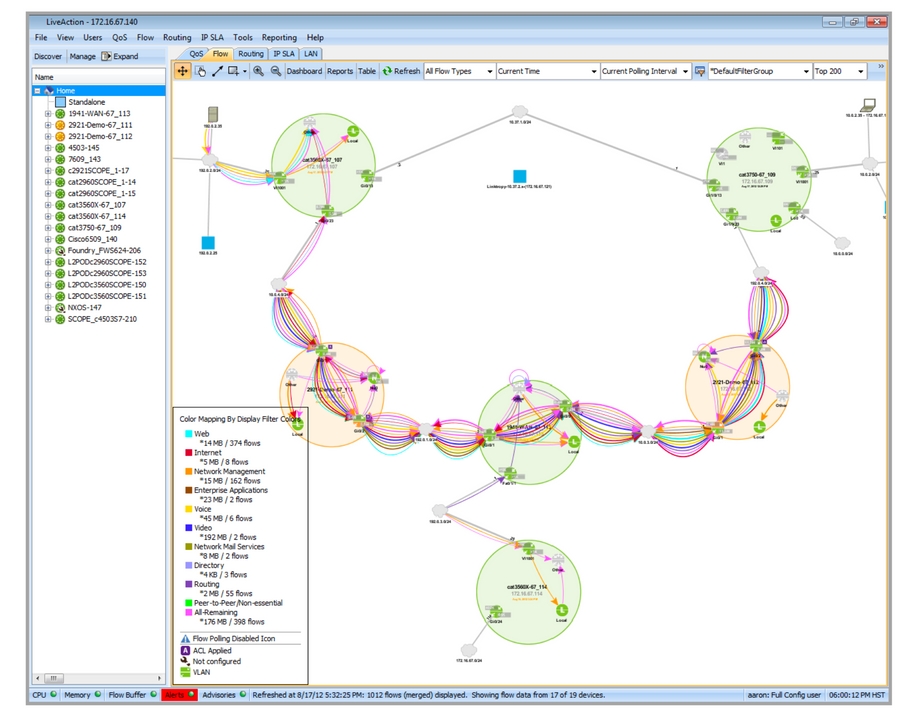
• Color Mapping Selector: provides the ability to color match the flows retrieved during the refresh by a certain algorithm.
• A Color Mapping legend is overlaid on the topology to indicate flow coloring and the number of bytes and flows that match each of the color mapping. The legend can be toggled on and off by opening the View menu and selecting Show Legends.
• Flows can be drawn on the system topology as merged or unmerged. This can be changed by going to the Flow menu and selecting Show Merged Flows.
• Mousing over a flow provides bit rate, total bytes, and source and destination information.
• Clicking on a flow, highlights each segment, so you can quickly trace the path of the flow across the network topology.
• Double clicking on a device in the system topology navigates to the device view for that device.
• Double clicking on a flow in the system topology opens the system flow table; highlighted rows in the table correspond to the flow of interest.